
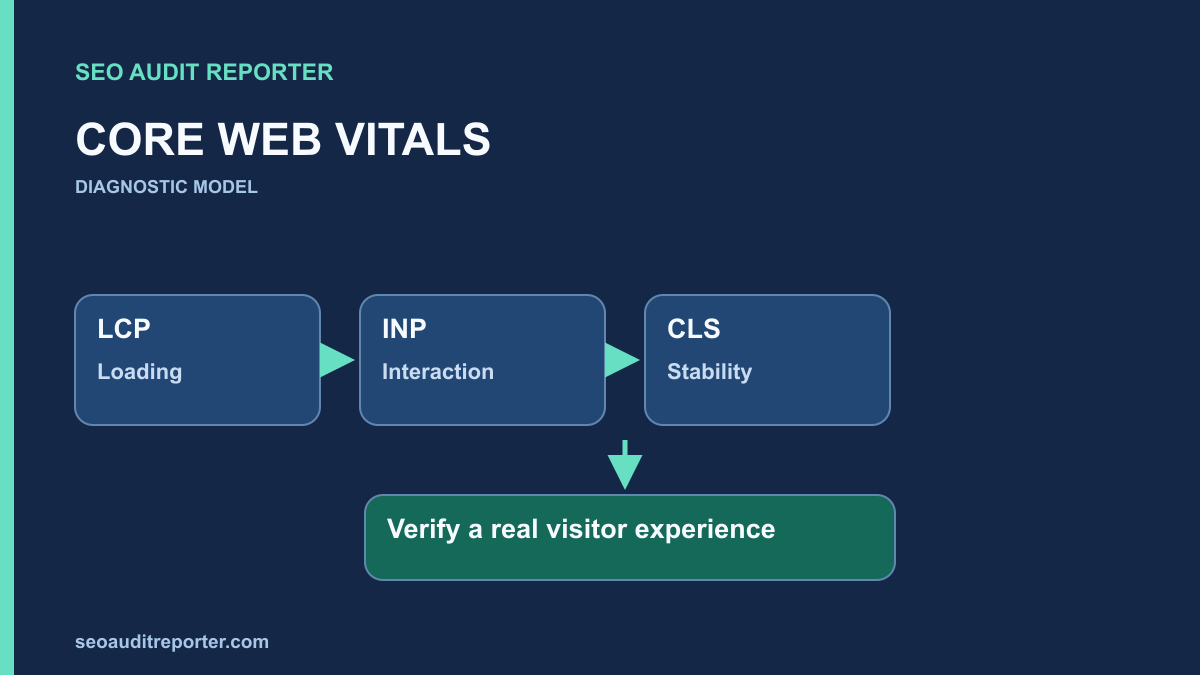
Performance investigation works best when every measurement has a purpose. Start with affected pages and real-user evidence, then use controlled tests to isolate the cause.
Understand the three measurements
Core Web Vitals describe loading, responsiveness, and visual stability through Largest Contentful Paint (LCP), Interaction to Next Paint (INP), and Cumulative Layout Shift (CLS). Google’s good-experience thresholds are LCP within 2.5 seconds, INP of 200 milliseconds or less, and CLS of 0.1 or less. See the official overview for the definitions and assessment context.
A good result is useful evidence about experience; it is not a promise of rankings. Avoid reducing a technical audit to a single performance score.
Begin with a real visitor problem
Ask which experience fails: important content appears late, an action responds slowly, or visible elements move unexpectedly. Capture the affected device group and observation period. The current Core Web Vitals are LCP, INP, and CLS; FID is a retired predecessor and should not be used as the current interaction criterion.
The Web Vitals reference describes assessment at the 75th percentile, segmented by mobile and desktop. A field aggregate and an individual test run have different meanings. Preserve the actual metric values and their scope rather than reporting only a combined green or red badge.
Separate field and lab evidence
Field data reflects real visits across devices and conditions. A lab run describes a particular simulated session. Record which kind of evidence you are using, whether it applies to a URL or an origin, and the date of the measurement.
If a tool does not have enough field data for a page, say so in your report. An absence of data is not a passing result. Likewise, a fast run on your own desktop does not prove that slower mobile connections have the same experience.
Know what each tool is showing
| Source | What it shows | What it cannot establish alone |
|---|---|---|
| CrUX | Aggregated eligible real-user experiences | The exact cause of one slow visit |
| PageSpeed Insights | CrUX field evidence when available plus a separate Lighthouse lab run | That its lab score equals every visitor’s experience |
| Lighthouse | Controlled loading diagnostics and supporting metrics | INP across a real visit from a load-only run |
| Browser DevTools | Request, main-thread, interaction, and visual traces for the recorded session | A representative population result from one trace |
The CrUX overview explains the real-user dataset. It requires eligible observations and does not include every visitor. Your own authorized real-user monitoring can add context, but compare its population and instrumentation before treating differences as a defect.
PageSpeed Insights documentation distinguishes field and lab evidence. Its field section reflects a trailing 28-day collection period and may fall back from a URL to an origin when page-level data is insufficient. Keep that scope visible. An origin fallback does not isolate one article’s template.
A standard load-only Lighthouse run does not perform the visitor interactions needed to measure visit-wide INP. Total Blocking Time can identify supporting main-thread concerns, but it is not a direct replacement for an interaction trace or field INP. Use browser traces while performing the actual slow action.
Choose representative pages
Group pages by their shared layout: the homepage, an article, a category archive, or another important template. Test a small sample from each affected group. Record viewport, connection settings, browser, cache condition, and whether you are signed in.
Use repeated runs to identify a consistent symptom, not to select the most flattering number. Keep other changes out of the test where possible so that a before-and-after comparison remains meaningful.
Compare URL groups and control pages
Choose affected pages and working siblings from the same template, then a control from another template. If only one page fails, inspect its content and resources. If a shared component fails across groups, investigate its common loading or interaction path. A Search Console URL group is a useful lead, not proof that every listed page has the same cause.
Record consent state, data volume, login state, cold or warm browser cache, and the interaction sequence. Separate mobile and desktop results. Use comparable repeated runs and keep the range, not just the best value. Do not call the first request a cold server-cache test unless the server cache state is actually known.
Follow the symptom to a likely cause
- Loading: inspect the main visible content, its request timing, resource size, and anything delaying rendering.
- Responsiveness: reproduce the slow interaction and inspect long-running work around that interaction.
- Layout shifts: watch for late content, images without reserved space, or interface elements inserted above existing content.
These are investigation prompts, not a diagnosis. Save a trace or a recording where the symptom is reproducible, and link it to the specific component responsible before proposing a broad refactor.
Identify the element or task that owns the delay
For loading, locate the reported LCP candidate in the trace. Separate server response, resource discovery, transfer, and render delay. A smaller image cannot remove time spent before its request begins. The LCP diagnosis explains these parts and how candidate changes can complicate comparisons.
For responsiveness, reproduce the actual click, tap, or keyboard action. Inspect input delay, handler work, and presentation delay. A stalled menu and a slow background request are not automatically the same timing problem. The INP diagnosis connects the delayed frame to the relevant main-thread work.
For stability, inspect which elements moved and what changed immediately before them. Images without reserved space, late banners, and font changes are possibilities, not conclusions. An element that moved may be the victim of a change above it rather than the generating cause. Keep a visual recording with the trace.
The CLS reference explains layout-shift measurement. Review shifts throughout the tested journey, including later content insertion. A stable initial viewport does not establish that a reader never experiences a disruptive movement after interacting or scrolling.
Make one focused repair
For example, reserve the expected space for an image if its arrival visibly moves the article text. Recheck several pages using that component, including unusual aspect ratios. For a slow interaction, profile the event and reduce the unnecessary work that the trace actually identifies.
Do not add a cache or optimization plugin solely because a score is low. First determine whether the problem is server response, resource delivery, rendering, or work performed after a user interaction.
Define the intended change and its tradeoffs
Write a hypothesis in terms of the evidence: make the LCP resource discoverable earlier, reduce a reproduced handler’s work, or reserve the demonstrated missing space. Name the component owner and a measurable acceptance check. Keep essential content, accessible controls, and accurate pending or error feedback intact.
Use the audit prioritization guide to weigh affected visitor reach, confidence, implementation effort, and dependencies. A widespread navigation stall may take priority over a narrow optional component. Avoid assigning severity from a single lab score without knowing which actual task or population is affected.
Check tradeoffs across metrics. Deferring initialization may improve loading while shifting expensive work to the first click. Changing fonts or placeholders can improve an early paint while causing later movement. Make a focused change and test the complete task so a smaller metric does not conceal a worse experience.
Verify both the symptom and the experience
Repeat the original lab check after deployment and compare the same interaction or loading sequence. Confirm that the change has not broken navigation, image quality, or layout. Monitor field reporting over time; historical reporting will not instantly become a measurement of only the new release.
A useful report ends with the affected template, evidence, implemented change, verification result, and remaining uncertainty. Keep “fixed in the test” distinct from “improved for real visitors” until the relevant evidence supports both.
Verify the deployment before waiting for field data
Load the public production page and confirm that the intended resource or component version is present. Repeat the same request conditions, viewport, interaction sequence, and data size. Compare the relevant timeline segment, candidate element, or shift source and inspect unaffected control pages for regressions.
The crawl comparison workflow supports complementary routing, metadata, and internal-link checks. A crawl cannot verify a responsive menu or reproduce a layout shift by itself. Keep functional checks, performance traces, and URL-level checks as separate evidence.
Return to comparable field observations
Record release time and monitor the same device and URL or origin segment. Rolling field data can contain visits from before the repair, so an immediate unchanged aggregate is not a clean measurement of the new version. New URL paths after a migration may also lack sufficient page-level history; do not infer a pass from absent data.
Report three outcomes separately: the change reached production, controlled tests reproduce the intended improvement, and later field evidence supports an improvement for visitors. If one remains unresolved, state it. This separation keeps a useful diagnostic workflow from becoming a claim that one successful test guarantees a lasting score or search result.
Related diagnostic guides
How to Diagnose a Slow Largest Contentful Paint (LCP) · How to Diagnose Interaction to Next Paint (INP) Problems · How to Compare a Crawl Before and After an SEO Fix